
Nonprofit Fundraising Metrics: 32 KPIs To Measure Success
As a nonprofit professional, you put a lot of work into your fundraising campaigns. You research fundraising software, conduct prospect research, market your initiatives, get to know your donors, plan events, thank your donors for their gifts, and more.
In other words, you put countless hours into your fundraising work. So, how do you know your efforts are worthwhile?
Of course, you believe in your cause and the work you’re doing to improve your beneficiaries’ lives. But how do you measure fundraising success so that you can improve future campaigns and raise more?
That’s where nonprofit fundraising metrics, or key performance indicators (KPIs), come into play. Tracking your fundraising metrics can help you improve your strategies, programs, and ultimately, fundraising results—if you effectively act on the information you’re gathering.
However, it can be difficult to know what KPIs to track, especially if you’re new to this way of measuring your progress and success. In this guide, we’ll dive into the nitty-gritty of nonprofit fundraising metrics, giving you everything you need to know to get started. We’ll also identify 32 specific metrics that your nonprofit should track.
Specifically, we’ll cover:
- An Introduction to Nonprofit Fundraising Metrics
- 3 Best Practices for Tracking Nonprofit Fundraising KPIs
- 32 Fundraising Metrics Your Nonprofit Should Consider Measuring
- Using Nonprofit Fundraising Metrics to Improve Your Strategy
Are you ready to make informed decisions about how best to navigate your future fundraising efforts? It’s time to start tracking your fundraising metrics! Let’s begin.

An Introduction to Nonprofit Fundraising Metrics
To effectively track and leverage nonprofit fundraising metrics, you’ll need a basic understanding of what they are and why they’re important.
What are nonprofit fundraising metrics?
Also known as nonprofit key performance indicators (KPIs), nonprofit fundraising metrics are measurable values meant to demonstrate how effectively a nonprofit is achieving key objectives.
Nonprofits use these metrics at two different levels to evaluate their success in reaching targets. “High-level” KPIs are big-picture-focused and help track overall performance. “Lower-level” KPIs zoom in on specific components of your nonprofit’s overall strategy.
Why is it important to track nonprofit fundraising metrics?
It’s important to track at least a few KPIs, even if your nonprofit is just starting. Tracking your fundraising metrics can be beneficial for multiple reasons. For example, tracking KPIs allows you to:
- Gather a large amount of accurate data about your organization
- Create detailed donor prospect profiles
- Make informed, evidence-based decisions
- Eliminate the guesswork of evaluating your organization’s success
- Identify the strategies that are working and the strategies that aren’t working
Without actionable insights from metric tracking, your nonprofit is instead forced to speculate on the success of its strategies.
For example, say your nonprofit had this question: “Would sending handwritten thank-you notes improve donor retention?” If you had no plans to actually track the retention rates in the population of donors receiving the thank-you notes, you’d have no way to know whether or not it’s worth it to keep writing and sending handwritten thank-you notes.
On the other hand, with carefully-selected, consistently-tracked metrics, you get real information and can move forward with the best plan of action for your organization.

3 Best Practices for Tracking Nonprofit Fundraising KPIs
Now that you have a foundational knowledge of what nonprofit fundraising metrics are and how they can help your nonprofit succeed, you’re likely eager to start tracking your own KPIs. In this section, we’ll provide some tips for how you can get a strong start on tracking your own metrics.
1. Determine the KPIs you want to track.
You may be tempted to try and track as many KPIs as possible. However, it’s best to focus on the goals and initiatives you’re implementing at your nonprofit. Too much data may actually hinder your team’s progress, overwhelming them to the point that no one knows what to focus on or where to begin adjusting your strategies.
Try selecting a combination of lagging and leading KPIs to assess your nonprofit’s performance:
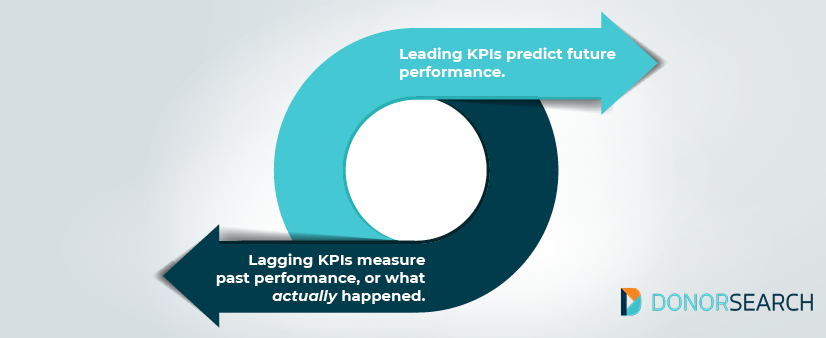
- Lagging KPIs are the metrics that measure past performance, or what actually happened. Some examples include average gift size, number of gifts secured, and event attendance.
- Leading KPIs are rates or percentages that may predict future performance. Some examples of these are donor retention rate, average donor growth, and average donation growth.
By tracking both leading and lagging KPIs, you can have a better understanding of the current state of your nonprofit’s performance and where you’re headed. Then, ideally, you can course correct to better accomplish your long-term goals!
2. Use software for tracking and calculations.
Especially if you’re opting to track many useful KPIs, you’ll be up to your ears in data!
This is why it’s in your organization’s best interest to use robust software to track the KPIs you value. Calculating your metrics manually, while possible, introduces the possibility of human error and may taint the accuracy of your metrics. Plus, it will eat up your team members’ valuable time to do so.
3. Give yourself enough time to see change.
Be patient as you begin tracking your nonprofit’s fundraising metrics. Less data (meaning data collected over just a short amount of time) may not always reflect your organization’s actual performance. Instead, data gathered over a long period of time can reveal true patterns and consistent trends that you can act on.
For example, say you have a month where your donor retention rate is unusually low. Trying to base your future decisions on data from just that month likely wouldn’t be a very smart move. Instead, to accurately understand and diagnose the problem, you should continue to measure your donor retention rate.
Simply put, more time equals more information. And more information can help you make better, more sustainable decisions.
32 Fundraising Metrics Your Nonprofit Should Consider Measuring
In this section, we’ll identify 32 fundraising metrics that your nonprofit may want to track. We’ll sort each of these metrics into the following categories:
- General Nonprofit Fundraising Metrics
- Donor Relationship KPIs
- Giving Level Metrics
- Engagement Metrics
- Online Performance KPIs
As you review each of these metrics and how to measure them, remember that you don’t have to track them all. Focus on the KPIs that will be most helpful to your specific nonprofit’s long-term goals.
General Nonprofit Fundraising Metrics
1. Cost Per Dollar Raised (CPDR)
Cost per dollar raised is one of the most commonly used fundraising success metrics. CPDR answers a simple question: Did we raise money, lose money, or break even? CPDR is useful to know for individual fundraising events so you can understand how individual campaigns worked, but can also give you an indication of your overall fundraising success.
How to Calculate This KPI
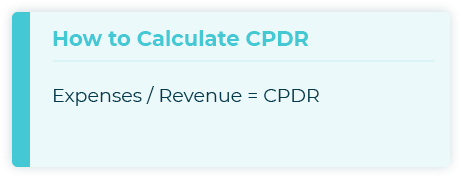
CPDR is determined by dividing expenses by revenue for the given fundraiser, campaign, or time period.
If expenses and revenue are equal, the calculation will yield 1, meaning that for every $1 you spent, you brought in $1. In other words, you broke even. If expenses were greater than revenue, the calculation will yield a number greater than 1, indicating a net loss. And a number less than 1 means more revenue was earned than expenses incurred, yielding a profit for the given event or time period.
Example of This KPI
Say you held an event that cost $500 to plan and execute and you raised $2,000 at the event. The numbers on their own can tell you that you made money, but if you want to know the ratio between expenses and revenue, evaluate your CPDR:
$500 / $2000 = 0.25
This tells you that for every dollar you brought in, you only spent $0.25.
2. Fundraising Return on Investment (ROI)
Fundraising return on investment is also a popular nonprofit fundraising metric. Like CPDR, it tells you the success or failure of a given fundraising pursuit.
But, as you will see, CPDR and fundraising ROI provide the same information, just framed in different ways. So why might a nonprofit prefer one of these metrics over the other?
If cost-cutting is a priority, nonprofits would likely be more interested in CPDR. If strategic planning for future fundraising efforts is the focus, fundraising ROI would be preferred.
How to Calculate This KPI
The calculation for fundraising ROI is the opposite of CPDR. Instead of expenses divided by revenue (which tells you how much you spent per dollar earned), fundraising ROI is found by dividing revenue by expenses.
The resulting number tells you how much you made per dollar spent. In this case, a number greater than 1 means you turned a profit, while a number less than 1 means you incurred a loss.
Example of This KPI
Let’s return to the example we used above—a fundraiser cost you $500 and you brought in $2,000. The following would be the ROI:
$2000 / $500 = 4
This indicates that for every dollar you spent, you made $4. So, the return on your investment is 4x.
3. Conversion Rate
Conversion rate shows a nonprofit how successful a given campaign was at getting people to complete an action, like donating or attending an event.
Conversion rate is one of the most cut-and-dry methods of evaluating the success of a given request for action. Measuring conversion rates can help your organization better understand your supporters’ giving preferences as well as the relative success of each of your outreach methods.
To find a conversion rate, you’ll first need to define your terms. What is the goal action you want your audience to complete? The goal action for a direct mail fundraising campaign might be returning a check with a donation, while the goal action for an email with volunteer opportunities might be registering for your volunteer program.
How to Calculate This KPI
To calculate conversion rate, divide the number of people who completed the goal action by the number of people who were given the opportunity to do so. Then, multiply that number by 100 to yield a percentage.
Example of This KPI
Say you sent out an email to 200 donors asking them to follow a link and make a donation online. Of those 200, 75 followed the link and used your online giving page or tool to complete their donations.
Let’s find the conversion rate:
75 / 200 = 0.375
0.37 x 100 = 37.5%
Your conversion rate in this instance was 37.5%, meaning the campaign had a 37.5% success rate.
4. Gifts Secured
Gifts secured is a measure of how many gifts your organization received over a given time period. If you track gifts secured over time, it’s common to say you are tracking “donation growth.”
You can also separate this metric by type of gift with categories like:
- Major gifts
- Planned gifts
- Mid-level gifts
- Small gifts
- Annual fund donations
- Monthly donations
This strategy allows you to see what specific audiences you are engaging with successfully and where you may want to do more outreach.
How to Calculate This KPI

Gifts secured is simply reported as a whole number.
Example of This KPI
If you received 7,580 total donations in 2020, your overall gifts secured metric is simply 7,580.
Likewise, if you’re measuring major gifts secured over 2021, you would report the metric as a whole number. You might have secured 7 major gifts or 75.
5. Matching Gift Rate
Your nonprofit’s matching gift rate represents the percentage of contributions matched through corporate philanthropy, or the number of donors who take advantage of their employer’s matching gift donations.
Since matching gifts don’t require donors to reach back into their wallets to increase their impact, neglecting to educate your supporters about their opportunities to have their gifts matched by their employers is like leaving free money on the table! In fact, Double the Donation asserts that a whopping $4-10 billion dollars in matching gifts go unclaimed every year.
How to Calculate This KPI
To find your matching gift rate, simply divide the number of donors who secured a donation match from their employers by your total number of donors. Then, multiply the resulting number by 100 to get a percentage.
Example of This KPI
Say you run a peer-to-peer fundraising campaign and want to calculate the matching gift rate of the campaign after it concludes. You see that out of 560 donors, 300 submitted gift matching requests to their employers.
To find the matching gift rate, you would do the following:
300 / 560 = 0.536
.536 x 100 = 53.6%
Your matching gift rate was 53.6%, meaning that nearly 54% of your donors took advantage of corporate matching gift programs during your peer-to-peer campaign.
6. Event Conversion Rate
Event conversion rate tells you the percentage of event attendees who become donors (or boost their giving level) after coming to one of your events. This fundraising metric is especially useful if you’re looking to evaluate how well your nonprofit team is doing at following up with people who participate in your organization’s events.
How to Calculate This KPI
To calculate your event conversion rate, simply divide the number of event attendees who gave a donation after your event or who increased their giving level after your event by the total number of event attendees. Then, multiply that number by 100 to yield a percentage.
Example of This KPI
You put together a family movie night and market your event to the community, and have 75 people attend. Afterward, you keep notes on the attendees that give a donation or increase their level of giving. You find that 40 of those people gave a donation or a larger donation after your event.
So, to find your event conversion rate, you calculate the following:
40 / 75 = 0.53
0.53 x 100 = 53%
This means that your event conversion rate was 53%, or that 53% of your event attendees gave a donation for the first time or gave a larger donation after attending the movie night.
7. Pledge Fulfillment Percentage
Pledges are funds promised to be paid to your nonprofit over a specific period of time. Track pledge fulfillment percentage to see how many of your donors are following through with their promised funds.
You’ll want to know if your pledges are following through or not because the implications for your accounting team are significant. Funds pledged are accounted for as cash in your annual budget; if the cash never appears, you may be going over budget. If donors are consistently backing out of pledge promises, you may need to reevaluate your pledge-acquiring strategies.
How to Calculate This KPI
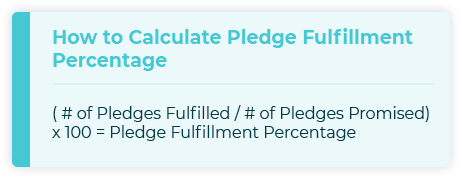
To calculate pledge fulfillment percentage, you divide total pledges fulfilled by total pledges promised and multiply by 100 to get a percentage.
Example of This KPI
Your nonprofit decides to host a walk-a-thon for its next fundraising event. Prior to the event, participants secure pledges from their family members and friends. Their supporters pledge to donate a certain amount of money per mile walked. After your event is over, you want to know how many supporters actually followed through with their donations. As you go through your post-campaign data, you see that 1000 pledges were promised, and 950 pledges were fulfilled.
To find your pledge fulfillment percentage, you do the following:
950 / 1000 = 0.95
0.95 x 100 = 95%
This shows you that 95% of all the pledges promised during your walk-a-thon turned into actual donations.
8. Recurring Gift Percentage
Recurring gift percentage tells you how many of your total gifts for a given time period were part of donors’ recurring gift schedules. This number can provide a baseline for recurring gift campaigns or give you an idea of expected funds in the future, even though they can’t be officially accounted for in next year’s annual budget.
How to Calculate This KPI
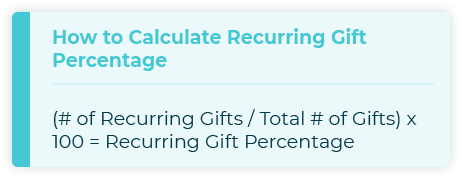
To find your recurring gift percentage, you divide the number of recurring gifts by the total number of gifts. Then, you multiply by 100 to get a percentage.
Example of This KPI
If 600 of your 3,000 donations in a given year were received as recurring gifts, you’d find the following recurring gift percentage:
600 / 3,000 = 0.2
0.2 x 100 = 20%
Thus, your recurring gift percentage is 20%.
9. Board Member Participation Rate
Many nonprofits have a policy requiring board members to make a personal contribution on an annual basis. Board member participation rate tells you what percentage of your board members are doing so.
As high-level team members, you’ll want your board members to be as invested as possible in the organization. Use this metric to leverage a fundraising conversation with them.
How to Calculate This KPI
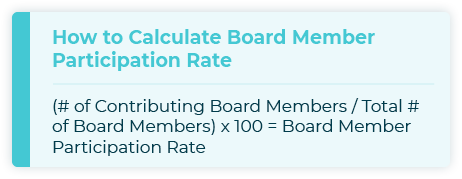
To find your board member participation rate, you divide contributing board members by total board members. Then, multiply by 100 to yield a percentage.
Example of This KPI
Say that 6 of your 14 board members make a personal contribution to your nonprofit on an annual basis. To find the board member participation rate, you would do the following:
6 / 14 = 0.43
0.43 x 100 = 43%
So, your board member participation rate would be 43%.
Donor Relationship KPIs
Where would your nonprofit be without its donors?
You already know that building and maintaining relationships with donors is a critical aspect of nonprofit success. These donor relationship metrics will help you see how well you’re managing those relationships and give you a jumping-off point for improvement!
10. Donor Retention Rate
Donor retention rate tells you how many donors your organization retains on a year-over-year basis.
To limit donor acquisition costs, you’ll want your donor retention rate to be as high as possible. Ideally, your acquisition and retention rates would improve concurrently.
Tracking your retention rate can reveal important insights about your organization’s performance, including:
- How successful various communication channels are.
- If your donor recognition efforts are sufficient.
- Which donation methods are preferred for returning donors.
If you do have a less-than-ideal donor retention rate, look to your stewardship practices first. What is your acknowledgment process? When do you follow up? How do you continue communicating with your donors? This should be a good starting point for reevaluating your donor retention efforts.
How to Calculate This KPI
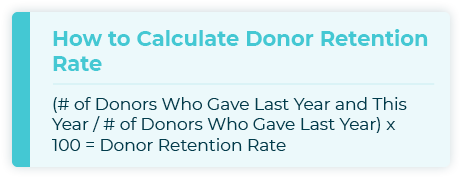
To calculate this year’s retention rate, you would divide the number of donors who gave last year and this year by the number of donors who gave last year. Then, you would multiply by 100 to yield a percentage.
Example of This KPI
Say you had 65 donors last year, and 20 of those donors also contributed this year.
That means you “retained” 20 of your 65 donors. Your donor retention rate is:
20 / 65 = 0.308
0.308 x 100 = 30.8%
This means your donor retention rate is 30.8% this year.
11. Lapsed Donor Rate / Donor Churn Rate
Your lapsed donor rate tells you the percentage of donors who were not retained from one year to the next. This is also referred to as donor churn rate.
Similar to a low donor retention rate, a high number or a high rate of lapsed donors is an indicator that you should investigate your donor retention efforts, like donor recognition and continued engagement campaigns.
How to Calculate This KPI
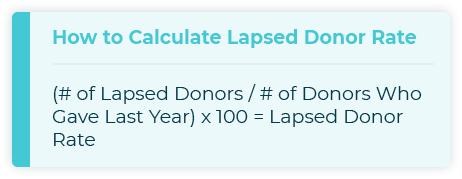
To find lapsed donors for this year, you first determine who donated last year. All of the donors who did not contribute again this year would be considered lapsed or churned donors. Next, divide the number of lapsed donors by the number of donors who gave last year. Then, multiply by 100 to get a percentage.
Example of This KPI
If you determine that 20 of your 65 donors from last year donated again, that means 45 did not. Thus, your number of lapsed or churned donors is 45. Your lapsed donor rate would then be calculated like this:
45 / 65 = 0.692
0.692 x 100 = 69.2%
Thus, your donor churn rate would be 69.2%.
12. Donor Growth Rate
Donor growth rate measures an increase or decrease in your organization’s total number of donors over a given time period.
Donor growth is considered a “domino metric,” meaning it’s often the result of a compounding list of factors. If donor growth is down, it’s probably not your only metric that’s looking less than ideal. Measuring your donor growth ensures that you’re paying attention to your overall performance and allows your nonprofit to address any concerns early and quickly.
Use this metric in conjunction with some of the others on this list to determine exactly why your number of donors isn’t growing.
How to Calculate This KPI
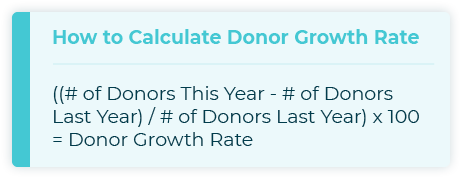
You’ll find your donor growth rate by subtracting the number of donors last year from the number of donors this year. Then, divide the resulting number by the number of donors last year. Next, you’ll take that number and multiply it by 100 to get a percentage.
Example of This KPI
Say you had 100 donors last year and 125 donors this year. Here’s how you would calculate your donor growth rate:
125 – 100 = 25
25 / 100 = 0.25
0.25 x 100 = 25%
So, your donor growth rate this year is 25%.
13. Donor Lifetime Value
Donor lifetime value (DLV) is a way to quantify the overall value a given donor will have for your organization. It’s important to recognize that this number is mainly used to make decisions about where to dedicate fundraising efforts and strategic campaigns. It is not useful as an assessment of a single donor’s lifetime value, but rather as an average lifetime value for a given subset of donors.
How to Calculate This KPI
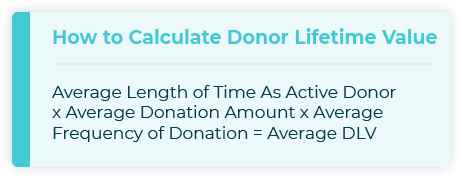
You calculate DLV with three numbers you’ll need to find beforehand:
- Average length of time as an active donor (This is also known as donor lifetime or donor lifespan.)
- Average donation amount
- Average frequency of donation
To find the average DLV, you’ll multiply these three averages together (average length of time as an active donor x average donation amount x average frequency of donation).
Example of This KPI
Say you wanted to know the differences in DLV between donors acquired by mail and donors acquired online in order to know which channel to prioritize.
First, you would find the above averages based on donor data for the two groups.
Then, for each group, you would take the average length of time as an active donor and multiply it by the average donation amount, then multiply that by the average frequency of donation.
The resulting numbers represent the total donation potential or DLV for the average donor from both groups.
14. Number of Donors by Type
Also referred to as fundraising diversity or diversity of fundraising sources, this metric tells you about the makeup of your donor base. The “types” commonly used for this metric are:
- Individual
- Foundation
- Government
- Corporation
Understanding what types of donors contribute to your organization can help you identify places to improve and strategize about fundraising going forward.
How to Calculate This KPI
There is no calculation necessary for this metric, just a simple tabulation of donors belonging to each group.
Example of This KPI
You might count 457 individual donors, 7 corporations that sponsor or donate to your nonprofit, and 2 foundations that support your organization.
15. Donor Acquisition Cost
Donor acquisition cost (DAC) is a representation of how much money your organization spends to acquire one donor. DAC data is especially useful when compared across channels, campaigns, or time periods. If you can demonstrate that one channel has a lower DAC than others, you should be able to defend your choice to invest further in that specific channel.
How to Calculate This KPI
DAC is calculated by dividing the amount spent on donor acquisition by the number of new donors acquired.
Example of This KPI
Say you spent $2,000 on donor acquisition in a given time period, and you acquired 56 new donors.
$2,000 / 56 = ~$36 per new donor
Thus, your DAC is $36.
16. Demographic Metrics
Tracking simple demographics like age, location, gender, or profession can help you better understand your pool of donors.
How to Calculate This KPI
There’s no need to calculate anything for this KPI. Simply count up the number of donors that fall into each demographic group.
Example of This KPI
For example, your nonprofit might have 135 individual donors who are between the ages of 20 and 30, 200 donors who are between the ages of 40 and 50, and 600 donors between the ages of 50 and 60. Likewise, 75% of your donors might be female and the other 25% might be male. You might also know that most of your donors live in the United States and Canada.
Giving Level Metrics
Metrics that examine donors’ giving levels can help you better understand the amount of funding you’re pulling in. And when you understand the money you’re currently getting, you can strengthen your strategies for pulling in even more.
17. Gift Frequency
Gift frequency tells you the average number of gifts you receive from your donor pool within a set time period (like a year).
How to Calculate This KPI
To figure out your gift frequency, all you’ll need to do is add up the number of times your donors make a gift in a given time period. Then, divide that number by the total number of donors your nonprofit has.
Example of This KPI
Say that you’re looking at a time period of one year. You have 500 active donors, and over that year, some donors give multiple times and some only give once. You add up the total of number donations over that year to be 780.
You calculate your gift frequency like this:
780 / 500 = 1.56
Thus, your gift frequency would be 1.56.
18. Average Gift Size
Average gift size is the average donation amount in a given donor group, campaign, or time period. This is a metric best used when tracked on a recurring basis. That way, you can see if your gift size is growing, staying the same, or decreasing.
There are a few ways of going about this. Measure average gift size:
- At the same event year-over-year to see your progress.
- At all of your events for the year (or, multiple years) to determine which events draw the largest donations.
- Over a repeated, fixed time frame (like six months or a year) to track general changes.
Average gift size can be a big help in evaluating the success of your fundraising and major gift efforts.
How to Calculate This KPI
To calculate average gift size, divide the total amount received by the number of gifts received.
Example of This KPI
You want to measure your average gift size for the past six months. You total the number of gifts you’ve received over that time and get 89. Then you add up the dollar amounts of each of those gifts to get $3,000.
So, to calculate the average gift size over the last six month, you do the following:
$3,000 / 89 = $33.71
Thus, the average gift size over the last six months is $33.71.
19. Average Giving Capacity
We all know the expression “Don’t leave money on the table.” In fundraising, sometimes “leaving money on the table” is securing a certain donation amount when you could have asked for and received a larger one.
The best way to avoid such situations is to know your individual prospects’ giving capacities, or how much they’re able to give. Comparing average giving capacity to average gift size should tell you if you’re “leaving anything on the table.” Ideally, the numbers would be very similar.
How to Calculate This Metric
You can determine an individual donor’s giving capacity by looking at three elements for each donor:
- The donor’s connection to your cause
- The donor’s philanthropic propensity
- The donor’s wealth markers
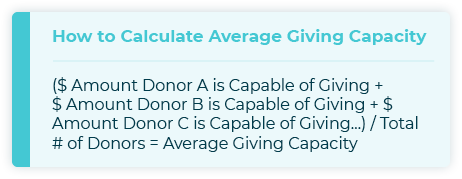
Using this information, you should be able to determine a dollar amount that the donor would be capable of giving. Then, you can figure out your donor pool’s average giving capacity simply by averaging each donor’s giving capacity. To calculate the average, simply add up the dollar amounts that you’ve determined each donor is capable of giving and divide it by the total number of donors.
Note that there are a few different averages you can take, depending on your organization’s specific situation, like:
- Determining the average giving capacities of your donors to help you decide how to bracket out your giving levels.
- Calculating the average giving capacity of a certain donor level to compare it with the average donation received from that donor level.
Example of This KPI
Say that you want to determine the average giving capacity of three major donors. Donor A has a giving capacity of $100,000. Donor B has a giving capacity of $60,000. And Donor C has a giving capacity of $75,000.
So, to find the average giving capacity for these three donors, you would do the following calculation:
$100,000 + $60,000 + $75,000 = $235,000
$235,000 / 3 = ~$78,333
The average giving capacity between these three donors is roughly $78,333.
20. Average Gift Size Growth
Average gift size growth measures the percent increase in average gift size year-over-year. This KPI is useful to contextualize donor growth. If donor growth is increasing but average gift size is not, you might want to spend less time focusing on bringing in new donors and more time cultivating the ones you have.
How to Calculate This KPI
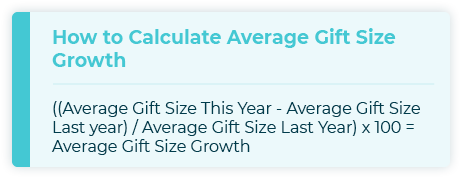
To determine average gift size growth, subtract the average gift size last year from the average gift size this year. Take that number and divide it by the average gift size from last year. Then, multiply by 100 to get a percentage.
In other words:
Avg. gift size growth = ((avg. gift size this year – avg. gift size last year)/avg. gift size last year) x 100
Example of This KPI
Your nonprofit’s average gift size last year was $80. This year, your average gift size is $95. To calculate your average gift size growth, you would do the following:
95 – 80 = 15
15 / 80 = 0.188
0.188 x 100 = 18.75%
Thus, your average gift size growth over the last year was 18.75%.
Engagement Metrics
Keeping your donors engaged with your nonprofit is key to boosting your fundraising. After all, when your donors have your nonprofit on their minds and feel seen and valued by your organization, they’ll be more inclined to give!
21. Frequency of Contact With Donors / Outreach Rate
Also known as outreach rate, this metric simply tells you how often your team is reaching out to your individual donors over a set period of time.
You can find this value for individual donors, but it’s most useful when averaged across a donor group. For example, to see if the frequency of donor contact influences conversion rates, determine the average contact frequency in the groups that did and didn’t convert and compare them.
Determining a good rhythm for donor contact is often a point of difficulty for nonprofits. Too much contact can become a nuisance and turn donors off, while too little risks losing potential donors. This value can help you establish a baseline from which to work to an optimal contact schedule.
Don’t forget to account for all the different communication channels, like:
- Phone calls
- Discussions at events
- Meetings
- Emails
Be mindful of including touchpoints from different communication channels in the same calculation. A lengthy in-person conversation and a single email blast might each qualify as “1 contact” in your computer, but lumping them in together could skew your data.
How to Calculate This KPI
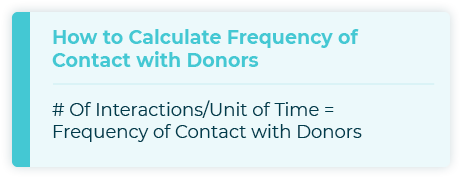
Frequency of contact with donors is simply expressed as the number of interactions per unit of time.
Example of This KPI
You may find that your team is reaching out to major donors over the phone 6 times per year. Or, you may find that the outreach rate for all donors is 12 times per year or 1 time per month.
22. Fundraising Participation Rate
As peer-to-peer fundraising and various iterations of “a-thons” grow in popularity, fundraising participation rate is more important to track than ever before.
Fundraising participation rate tells you how many of those who attended or donated to your fundraiser or fundraising event actually did fundraising themselves. For example, a participant in your road race who paid an entry fee is not a fundraiser. However, if that same participant gathered pledges in addition to the entry fee, they are then a fundraiser.
If this rate is lower than you want it to be, you’ll know to increase your marketing efforts to highlight the individual fundraising aspect of your fundraisers.
Event attendees who donate and double as fundraisers are unquestionably assets. Examining this rate can tell you if your organization is missing out on a valuable opportunity.
How to Calculate This KPI
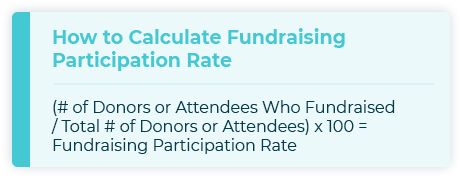
To calculate fundraising participation rate, you divide the number of donors/attendees who fundraised by the total number of donors or attendees.
Example of This KPI
Perhaps 120 people attended your recent dance-a-thon, but only 70 of those attendees fundraised on your behalf prior to the event.
To calculate your fundraising participation rate, you would do the following:
70 / 120 = 0.583
0.583 x 100 = 58.3%
So, your fundraising participation rate for your dance-a-thon was 58.3%.
23. Asks Made
Asks made is the number of direct requests for contributions made to a given donor or group of donors. You can further focus asks made to specific campaigns or periods of time for more specific data.
Asks made elaborates on donor contact and provides a metric for how aggressive your fundraising efforts are.
Use asks made along with frequency of contact with donors to examine differences in conversion rates for various campaigns. You may find that more asks led to a higher conversion rate or vice versa, which can help you come to an optimal outreach strategy for the future.
How to Calculate This KPI
There’s no need to calculate anything to determine the number of asks made. Simply keep track of how many fundraising asks or appeals your team has made in a certain time or throughout a specific campaign.
Example of This KPI
Perhaps you count up the number of asks made over your end-of-year campaign. You find that your team made 1,225 fundraising asks over the course of the campaign.
Online Performance KPIs
With so much fundraising now taking place in the digital space, you’ll also need to track fundraising metrics that tell you how well your nonprofit is performing online. These KPIs will examine multiple aspects of your digital presence, from your online donation page to your social media profiles.
24. Online Gift Percentage
Online gift percentage is a measure of how many of your donations come from online vs. other channels like fundraising events and mail-in donations.
Your online gift percentage, if lower than anticipated or lower than peer organizations’ rates, may indicate you need to step up your digital marketing and/or email campaigns.
You can also use online gift percentage when planning a marketing strategy for the upcoming year/month/etc. For instance, the percentage of donations that come from online vs. direct mail can guide your budgeting process and help you allocate funds to the most useful channels.
How to Calculate This KPI
Calculate online gift percentage by dividing the number of online gifts by the total number of gifts over a given time period. Then, multiply that number by 100 to obtain a percentage.
Example of This KPI
Say you’ve received 600 gifts over a period of six months and want to know what percent of those gifts were made online. You see that 450 gifts were made online.
Thus, your online gift percentage calculation would look like this:
450 / 600 = 0.75
0.75 x 100 = 75%
So, your online gift percentage for that six-month period was 75%.
25. Email Open Rate
Email open rate is the percentage of email recipients who actually opened the given campaign, newsletter, or request.
Email open rates are incredibly useful for guiding your email marketing choices. Once you have a baseline open rate, try changing one thing about your emails at a time. Consider altering:
- Subject line
- Sender name/email address
- Time of sending
The open rate results after every change will be invaluable evidence for the success or failure of each change you make, helping you build a strategy supported by the numbers.
How to Calculate This KPI
To find email open rate, divide the number of email recipients who opened your email by the number of total email recipients. Then, multiply the resulting number by 100 to get a percentage.
Example of This KPI
Maybe you send out 800 emails to remind a particular segment of your donors about an upcoming fundraising event. Of the 800 people who receive your email, 300 people open the email.
You would calculate your email open rate like this:
300 / 800 = 0.375
0.375 x 100 = 37.5%
So, your email open rate for your event reminder email was 37.5%.
26. Email Click-Through Rate
Email click-through rate describes the percentage of people who click on links in your emails to access other pages, like your website or donation page. Used in combination with email open rates and conversion rates, this metric can help you identify where your marketing is weakest.
If you have a low email click-through rate, try repositioning your calls-to-action (CTAs) to more prominent or clear locations and personalizing your emails as much as possible through smart donor segmentation.
How to Calculate This KPI
Email click-through rate is obtained by dividing the number of subscribers who click on a link in your email by the total number of emails delivered. Then, multiply the resulting number by 100 to yield a percentage.
Example of This KPI
Your nonprofit sends its weekly email newsletter to 500 recipients. Of those 500 recipients, 60 click through to your donation page.
You would calculate your email click-through rate like this:
60 / 500 = 0.12
0.12 x 100 = 12%
Your email click-through rate for this edition of your newsletter was 12%.
27. Email Opt-Out Rate
Email opt-out rate is a representation of how many of your email subscribers “unsubscribe” from the email stream.
If too many people unsubscribe from an email stream or newsletter, the communication stream gets labeled as spam and begins getting filtered out from your subscribers’ inboxes. Email opt-out rate can help you keep track of opt-outs before it gets to that point, giving you time to reconsider your email approach.
How to Calculate This KPI
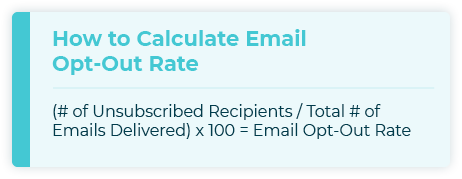
To find your email opt-out rate, divide the number of unsubscribed by the number of total emails delivered. Then, multiply by 100 to get a percentage.
Example of This KPI
Perhaps you want to know the email opt-out rate for your annual email campaign leading up to Giving Tuesday. You see that 5,000 emails have been delivered, and 2,500 people have unsubscribed from your email campaign.
To calculate your email opt-out rate, you would do the following:
2,500 / 5,000 = 0.5
0.5 x 100 = 50%
So, your email opt-out rate for this campaign is 50%.
28. Website Page Views
Website page views refers to the number of times users access pages on your nonprofit’s website. It’s important to note that website page views is not a metric describing how many people accessed a site; it’s merely the number of times the page was loaded/viewed. There is no way to account for repeat viewings, so if a volunteer trying to find information for an event accesses the same page 10 times, that will increase that page’s views by 10.
Website page views are useful especially in combination with other digital metrics like email open rates and click-through rates to try to pinpoint what part of your digital marketing needs improvement. If you have high open rates, high click-through rates, and high page views, but low conversion rates, it’s probably an indicator of a weakness in your website’s content or design.
Try moving your CTAs to more prominent locations, increasing emotional appeals, and clarifying your mission/purpose on your home page.
How to Calculate This KPI

There’s no need to do any calculations to figure out website page views. Simply use a tool like Google Analytics to get the number of views.
Example of This KPI
You might compare the website page views for your informational page on volunteering and your volunteer registration page to figure out if visitors are acting on the information they’re getting or not.
You use an analytics tool to see that your informational page has gotten 5,000 views in the past month, whereas your registration page has gotten 4,500 views in the last month.
29. Landing Page Conversion Rate
Landing page conversion rate measures how many of your page visitors actually complete the goal action on the page, like donating or downloading something.
After you’ve done the hard work of getting donors to your landing page, the last thing you want them to do is click away because a form is too long or confusing. A lower-than-expected landing page conversion rate may indicate room for improvement on your landing page, such as streamlining or shortening the requested fields on your donation form.
How to Calculate This KPI
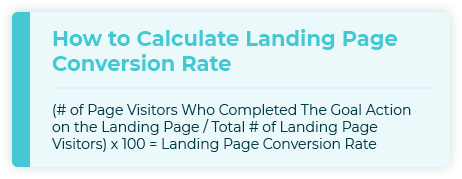
To find landing page conversion rate, divide the number of page visitors who completed the goal action by the total number of landing page visitors. Then, multiply by 100 to get a percentage.
Example of This KPI
Perhaps you see that your donation page has had 10,000 visitors in the last month. But you see that only 3,000 people have completed a donation after landing on your page.
Here’s how you would calculate the landing page conversion rate:
3,000 / 10,000 = 0.3
0.3 x 100 = 30%
So, your landing page conversion rate for your donation page would be 30%.
30. Amplification Rate
Amplification rate tells you the ratio of shares per social media post to the number of overall followers. This makes this metric handy for understanding how often your followers are sharing your social media content., thus spreading your content through their own personal networks of family, friends, and coworkers.
How to Calculate This KPI

To find amplification rate, divide the number of shares your social media post got by the total number of followers you have on that platform. Then, multiply the resulting number by 100 to yield a percentage.
Example of This KPI
Say your nonprofit has 120,000 followers on Twitter, and a recent tweet about an upcoming in-kind donation drive gets shared 90,000 times.
Here’s how you would calculate your amplification rate:
90,000 / 120,000 = 0.75
0.75 x 100 = 75%
Thus, your amplification rate would be 75%.
31. Applause Rate
Applause rate is the number of approval actions (such as likes) a single post received relative to the number of followers you have on that platform. Understanding your applause rate can help you know which types of posts get the most attention from your audience on each platform you’re using.
How to Calculate This KPI
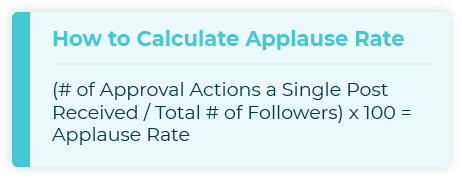
To find your applause rate, divide the total number of approval actions on a single post (within a set period of time) by the total number of followers you have on that platform. Then, multiply by 100 to get a percentage.
Example of This KPI
Say you posted a picture on Facebook of your volunteers hard at work and want to measure its applause rate over the last month. You see that the post has gotten 60 shares over the last month. You also see that you have 400 followers on Facebook.
So, to calculate the applause rate for this particular post, you would do the following:
60 / 400 = 0.15
0.15 x 100 = 15%
Your applause rate for this post is 15%.
32. Social Media Conversion Rate
Social media conversion rate shows you how often people take an action (like donating) after clicking on a link in a social media post relative to the total number of people who visited the web page where the task can be completed.
Knowing your social media conversion rate can help you better understand where your website visitors are coming from to complete important actions like donating, subscribing to newsletters, and more.
How to Calculate This KPI
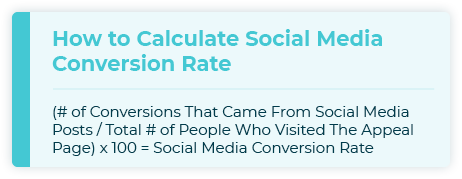
To find social media conversion rate, divide the number of conversions that came from social media posts by the total number of visitors to a particular appeal page. Then, multiply by 100 to yield a percentage.
Example of This KPI
You optimize your donation form and let your donors know about the revamp through a few different marketing channels, including social media. You find that 7,000 people total visited your new donation page and that 3,000 converted by submitting a donation. Of those 3,000, you see that 1,000 people came to your new donation page through social media.
So, to calculate your social media conversion rate for the new donation page, you would do the following:
1,000 / 7,000 = 0.143
0.143 x 100 = 14.3%
Thus, your social media conversion rate for your new donation page is 14.3%.
Using Nonprofit Fundraising Metrics to Improve Your Strategy
Clearly, there are a lot of KPIs that your nonprofit can track in order to improve its approach to fundraising. But how do you go from calculating a percentage to actually improving your day-to-day operations so that you see more fundraising success? You’ll find that there are several ways to put your metrics to good use.
Use Your Metrics for Insightful Comparisons
KPIs are almost always useful for making comparisons, like:
- Comparing your organization’s average gift size this year to its average gift size last year
- Comparing your organization’s average gift size to a similar organization’s average gift size
Metrics evaluated over time can show you trends and movements in data, while metrics across organizations can tell you how you compare to the “standard” or to other nonprofits whose strategies you would like to emulate.
Present Metrics Data in Visual Forms
Before you make too many changes based on KPIs, you’ll likely have to present the data to the board of your organization.
It can be tempting to go into a high level of detail when reporting statistics to others, but be sure to consider your board members’ time and positions. As high-level members of your team, they have a bird’s eye view of the organization. They probably won’t want to hear all of the granular details that contributed to your retention rate decreasing by 2 points this year. They’ll want to see a graph descending slightly from left to right.
Communicating your KPIs to others is best achieved by simplifying the numbers into easily-digestible forms. Often, that means producing a visual representation of the trend or statistic. This is an effective approach because visuals are easy to understand and remember. In fact, research shows that we process visuals a whopping 60,000 times faster than text. So, don’t be afraid to lean into visual representations when preparing to share your data, whether you’re preparing for a board meeting or drafting up your organization’s annual report.
Leverage Your KPIs to Set Specific Goals
To really act on the data you’re finding, you should set specific goals that will help you integrate your new information into your strategies.
For example, if you see that your event conversion rate is much lower than you want it to be, you might set a SMART goal (specific, measurable, achievable, relevant, and timely) to increase that conversion rate. You might set the following goal using this tried-and-true method: “At our next event in three weeks, we will aim to have a staff member, board member, or volunteer speak with each event attendee and invite them to make a donation on our online donation page, with a goal of getting X positive responses. Afterward, we’ll again calculate our event conversion rate to see how this new tactic improves our results.”

Final Thoughts
Information is power, especially when it comes to your nonprofit better understanding its donor pool and fundraising results. By measuring your fundraising metrics, you will not only have the ability to understand where your nonprofit is and where it’s headed but also the chance to course-correct and improve so you see the success you’re working toward.
Rely on this guide to determine which KPIs will be most useful for your nonprofit to track, and get started today keeping tabs on your data and looking for trends. You’ve got this!
Looking to learn more about the world of fundraising? We’ve got you covered. Check out these articles:
- Creating Your Nonprofit Annual Report: Full Guide & Template. Your organization’s annual report is a great place to showcase your fundraising metrics. Learn about how to create your report in this guide.
- Prospect Research 101: A Crash Course for Nonprofits. Prospect research is the process of sifting through your donor and prospect data to find new major donors. Learn all about it in this guide.
- Major Donor Fundraising: How to Strengthen Your Strategy. Major donors are an important part of a nonprofit’s donor ecosystem, but finding them and building relationships with them can be challenging. Check out this article for actionable advice.